What does Thermo Fisher’s one-year gain actually signal about life-science infrastructure?
<figure class="blog-chart" style="max-width:640px;margin:1.5rem auto;font-size:12px;line-height:1.3;color:inherit"> <svg viewBox="0 0 560 380" style="max-width: 100%; height: auto; font-family: 'Inter', system-ui, sans-serif; color: #1e293b; --chart-muted: #64748b;" role="img" aria-labelledby="thermo-fisher-fy2025-segment-revenue-title thermo-fisher-fy2025-segment-revenue-desc"> <style> /* The renderer puts the chart in an iframe whose element background is black, and the iframe is a different shape to the chart, so the letterbox bands showed as black frames around it (prod 09-22). The document inside the iframe is transparent by default; painting it here covers the element background, and when the chart is inlined instead this matches nothing. Keep angle brackets out of this block: a style element inside an SVG is parsed as foreign content, so one stray bracket discards every rule in it. */ html, body { background: #ffffff; margin: 0; } @media (prefers-reduced-motion: reduce) { * { animation: none !important; transition: none !important; } } </style> <rect x="0" y="0" width="560" height="380" rx="8" fill="#ffffff" /> <title id="thermo-fisher-fy2025-segment-revenue-title">Thermo Fisher FY2025 segment revenue</title> <desc id="thermo-fisher-fy2025-segment-revenue-desc">Laboratory Products and Biopharma Services led FY2025 segment revenue at $23.984B, ahead of Life Sciences Solutions at $10.374B, Analytical Instruments at $8.259B and Specialty Diagnostics at $4.939B. Thermo Fisher FY2025 segment revenue. horizontal bar data: Lab Products & Biopharma 23.984; Life Sciences Solutions 10.374; Analytical Instruments 8.259; Specialty Diagnostics 4.939.Source: Thermo Fisher Scientific, FY2025 Form 10-K 2025.</desc> <text x="280.0" y="29" text-anchor="middle" font-size="18" font-weight="800" fill="currentColor">Thermo Fisher FY2025 segment revenue</text> <line x1="145" y1="298.0" x2="510" y2="298.0" stroke="currentColor" opacity="0.08" /> <line x1="145" y1="243.0" x2="510" y2="243.0" stroke="currentColor" opacity="0.08" /> <line x1="145" y1="188.0" x2="510" y2="188.0" stroke="currentColor" opacity="0.08" /> <line x1="145" y1="133.0" x2="510" y2="133.0" stroke="currentColor" opacity="0.08" /> <line x1="145" y1="78.0" x2="510" y2="78.0" stroke="currentColor" opacity="0.08" /> <text x="136.0" y="109.8" text-anchor="end" font-size="11" fill="currentColor" opacity="0.8"><tspan x="136.0" dy="0">Lab Products &</tspan><tspan x="136.0" dy="12">Biopharma</tspan></text> <rect x="145" y="78.0" width="365.0" height="49.0" rx="4" fill="#f97316" /> <text x="518.0" y="109.8" font-size="11" fill="currentColor">23.984</text> <text x="136.0" y="166.8" text-anchor="end" font-size="11" fill="currentColor" opacity="0.8"><tspan x="136.0" dy="0">Life Sciences</tspan><tspan x="136.0" dy="12">Solutions</tspan></text> <rect x="145" y="135.0" width="157.9" height="49.0" rx="4" fill="#38bdf8" /> <text x="310.9" y="166.8" font-size="11" fill="currentColor">10.374</text> <text x="136.0" y="223.8" text-anchor="end" font-size="11" fill="currentColor" opacity="0.8"><tspan x="136.0" dy="0">Analytical</tspan><tspan x="136.0" dy="12">Instruments</tspan></text> <rect x="145" y="192.0" width="125.7" height="49.0" rx="4" fill="#a78bfa" /> <text x="278.7" y="223.8" font-size="11" fill="currentColor">8.259</text> <text x="136.0" y="280.9" text-anchor="end" font-size="11" fill="currentColor" opacity="0.8"><tspan x="136.0" dy="0">Specialty</tspan><tspan x="136.0" dy="12">Diagnostics</tspan></text> <rect x="145" y="249.0" width="75.2" height="49.0" rx="4" fill="#22c55e" /> <text x="228.2" y="280.9" font-size="11" fill="currentColor">4.939</text> <text x="280.0" y="366" text-anchor="middle" font-size="10" fill="var(--chart-muted, currentColor)">Source: Thermo Fisher Scientific, FY2025 Form 10-K (2025)</text> </svg> </figure>
Peptide Test Factory Reconstitution Peptides The gain tracks a diversified instrument, consumable and services business, not a peptide bet. Thermo Fisher’s fiscal 2025 annual report puts consolidated revenue at $44,556 million, up 4% reported and 2% organic from $42,879 million in 2024, with Laboratory Products and Biopharma Services at $23,984 million and Life Sciences Solutions at $10,374 million. Its 10-K segment breakdown lists Analytical Instruments at $7,554 million and Specialty Diagnostics at $4,676 million, while the narrative in the same filing gives $8.259 billion and $4.939 billion; the table reconciles to the total once $(2,033) million of eliminations are applied, so quote the table.

The disclosed growth driver is upstream and downstream capacity. The bioproduction line in the same filing reached $3,200 million in 2025, up $548 million, and bioproduction drove Life Sciences Solutions organic growth; the segment discussion in the 10-K places bioproduction among three primary businesses in that segment and notes the September 1, 2025 acquisition of the Solventum filtration and separation business. The integration language is services-side: the segment descriptions in the filing describe Laboratory Products and Biopharma Services as offering “virtually everything needed for the laboratory” and clinical research as “comprehensive, integrated clinical development,” and management described its Accelerator offering as integrated CDMO and CRO on the 2026-01-29 call. Nothing in a full-text reading of the filing supports reading the return as peptide-service consolidation, which is the honest limit of the signal.
What is an integrated peptide research workflow, and where do cross-vendor handoffs cost time and reproducibility?
That portfolio signal says nothing about the chain a peptide lot travels, so start with what the chain is. An integrated peptide research workflow is one continuous, version-controlled record from sequence design through synthesis, purification, characterization and the release decision, so that any lot can be traced back to the exact sequence and method that produced it. The cost of a broken chain shows up at peptide synthesis and purification handoffs, where a method or a sequence crosses a company boundary. ICH Q2(R2) requires partial or full revalidation of affected characteristics and/or comparative testing of representative samples between originating and receiving laboratories when a validated procedure moves, with the extent justified by the procedure, the change and prior knowledge. The validation matrix in ICH Q2(R2) makes the consequence concrete: identity needs specificity alone, while purity and assay each carry their own characteristic set, so a transferred HPLC purity method arrives with work attached.

What each stage must pass forward is defined at the starting-material end. The EMA guideline on synthetic peptides requires protected amino acid derivatives to be specified for appearance, identification, related impurities (enantiomeric, diastereomeric, partially unprotected amino acids, dipeptides, β-alanyl impurities), other impurities and assay, with a criticality assessment of which starting-material impurities can affect the peptide’s impurity profile. One CDMO’s technical account of why transfers slip names missing process understanding, equipment differences and late process lock, and states that processes “can be significantly delayed and in some instances, fail to launch”; no source in this set quantifies a peptide-specific rework rate, so treat any percentage you are shown as unverified.
Key Takeaway: The record set that catches a version-trail failure is field-level: sequence version, modification site and chemistry, lot, method ID, column, gradient, wavelength and reference standard, each tied to the release decision it supported.

What must a connected peptide data package carry, and how do purity, identity, net peptide content, counterion and stability differ as release attributes?
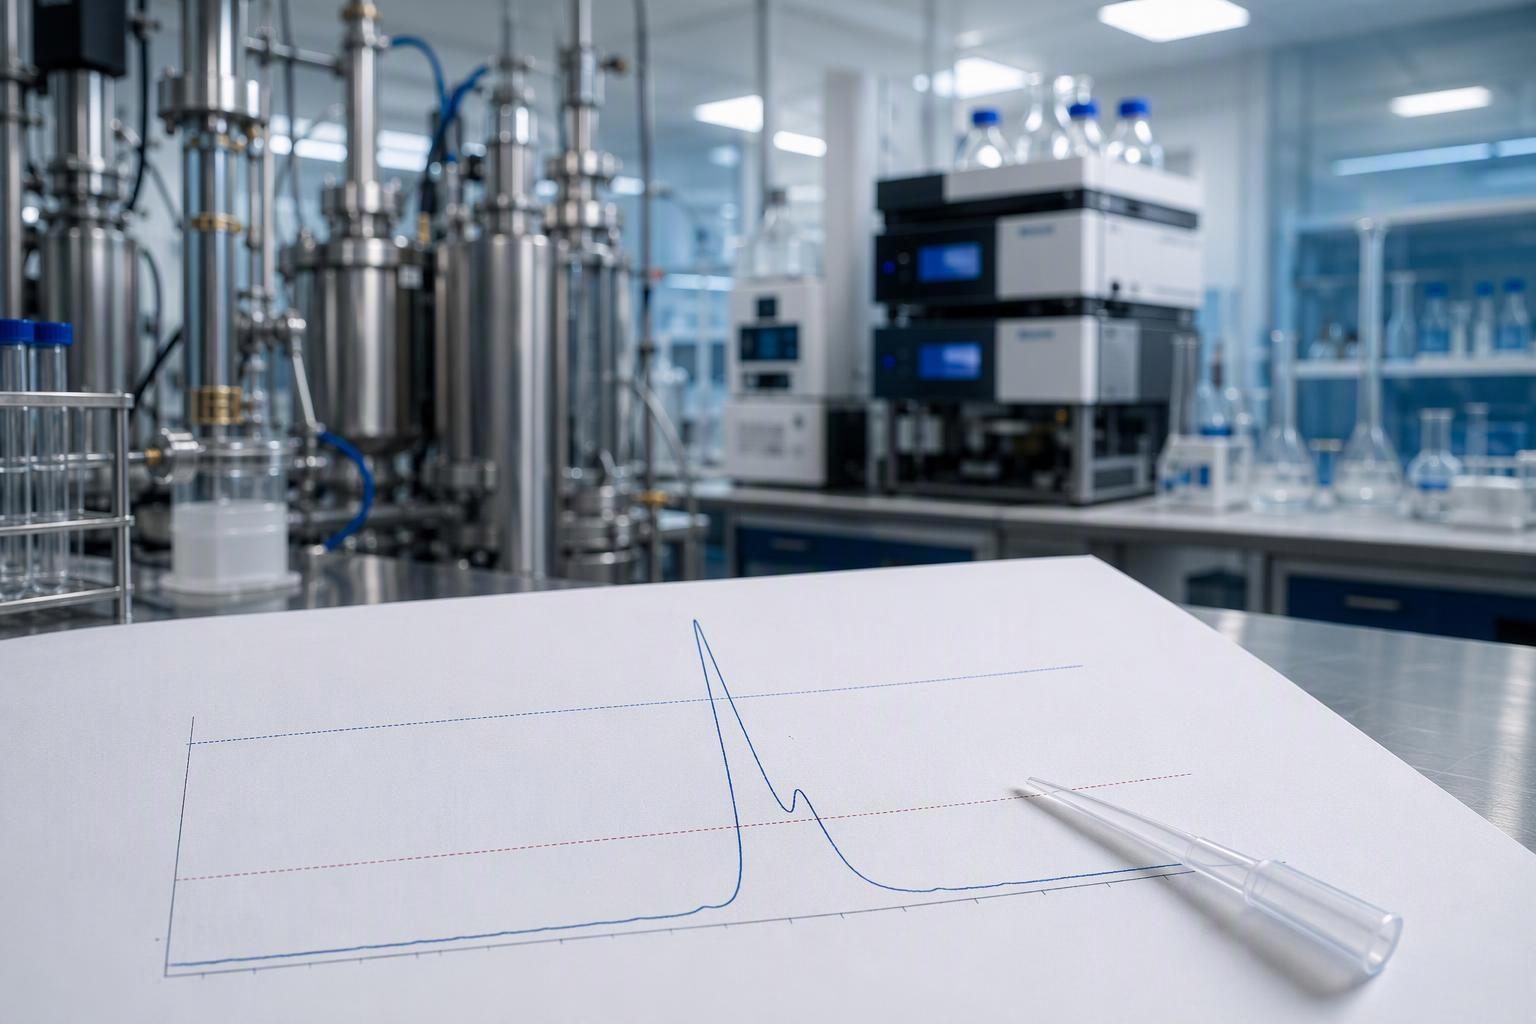
Those fields only matter if each one answers a distinct release question, and no single number substitutes for another. The EMA guideline on synthetic peptides sets peptide-related impurity thresholds at 0.1% report, 0.5% identify and 1.0% qualify, requires impurity methods able to meet the 0.1% reporting threshold, applies the 1.0% qualification threshold to co-eluting impurities seen as one peak, and recommends at least two orthogonal methods for identity at release. The same guideline’s effective date is 1 June 2026, adopted by CHMP on 1 December 2025 and CVMP on 4 December 2025.
|
Release attribute |
Question it answers |
Establishing method |
Governing standard |
|---|---|---|---|
|
Purity |
How much peptide-related impurity Cell Penetrating Peptides is present, and is it above 0.1%? |
HPLC with a validated reportable range to 0.1% |
EMA thresholds |
|
Identity |
Is the sequence what the order specified? |
At least two orthogonal methods (MS, peptide mapping, amino acid analysis, NMR) Solutions Peptide |
EMA gu Peptides Supplier Wholesale ideline |
|
Net peptide content |
How much peptide base is in the vial? |
Assay by LC, elemental analysis, amino acid analysis, Kjeldahl nitrogen or qNMR |
|
|
Counterion |
Which salt form, and at what justified upper limit? |
Counter-ion identity and content testing |
|
|
Stability |
Does the lot still meet specification over its assigned period? Polypeptid |
Long-term, intermediate and accelerated studies |
Counterion is where lot-to-lot peptide consistency breaks quietly. The assay requirements in that guideline express assay on the counter-ion-free, anhydrous basis and define strength as peptide base mass, and the counter-ion section of the guideline requires counter-ion identity and content with a justified upper limit, noting acetate is usual but trifluoroacetate or chloride are possible. The guideline’s counter-ion logic means two lots at the same HPLC purity can differ in deliverable peptide.
Design stability studies for the material, use and development stage. Q1A registration examples do not impose the same ambient, intermediate and accelerated design on every research peptide or storage condition.
Use K/M only in its applicable product and route context, with consistent dose units. The common 5 EU/kg value for specified non-intrathecal parenteral uses is not a universal criterion for every route or laboratory assay. Demonstrate endotoxin-method suitability where testing is needed.
⚠️ Warning: Material intended for in vivo or clinical use carries additional qualification requirements beyond the attributes above. Confirm scope with your own regulatory and quality function before relying on any supplier package.
How we apply this at MOL Changes, the publisher of this guide. Our peptide testing work covers mass spec for identity, HPLC for percent purity, pH, peptide content determination and endotoxin testing, and orders include HPLC, MS and pH reports, so those release attributes can arrive as measured values rather than as a single purity number. What we do not do is guarantee stability: no customer document we hold states a stability programme, so shelf-life and degradation data remain the reader’s own responsibility, gathered in their own stability study with any supplier, ours included.
What decision rule should a team apply to judge whether a peptide workflow and its suppliers are truly connected?
With those attributes defined, the test is whether a supplier package actually carries them, so apply five questions to a real package and stop at the first one that fails. First, does the package state sequence version, modification site and chemistry, and lot on the same document as the results? Second, does identity rest on at least two orthogonal methods, as the EMA guideline on synthetic peptides recommends for release? Third, does the purity method have a validated reportable range down to 0.1% under ICH Q2(R2), rather than a generic limit? Fourth, are counterion identity and content, water and net peptide content reported, per the counter-ion section of the guideline? Fifth, are the electronic records inspection-ready?
That last question carries regulatory weight. MHRA’s GxP data integrity guidance defines ALCOA as Attributable, Legible, Contemporaneous, Original and Accurate, with the “+” adding Complete, Consistent, Enduring and Available, and states there is no difference in expectation whichever acronym is used. 21 CFR 11.10(e) requires secure, computer-generated, time-stamped audit trails that do not obscure prior data and are retained at least as long as the subject records, while 11.10(a), (c) and (d) cover validated systems, retrievability and access control. 21 CFR 11.50 and 11.70 require each signed record to show the signer’s printed name, date and time, and meaning, with the signature linked so it cannot be excised. FDA’s Part 11 scope guidance is explicit that a paper printout does not remove the obligation when the electronic record is what the firm relies on.
Supplier acceptance is conditional, not automatic. 21 CFR 211.84 allows a supplier report of analysis in lieu of full purity, strength and quality testing only if at least one specific identity test is performed and the manufacturer establishes supplier reliability through validation at appropriate intervals. ICH Q9(R1), effective 26 July 2023, ties supplier oversight to risk assessment and states that resource constraints should not justify lower formality. These are the peptide vendor evaluation criteria that separate a connected supplier from a fast one.
Pro Tip: Run the five questions against one real certificate of analysis this week. A “no” on question one or two means the rest of the package cannot be relied on for a regulated decision.
Frequently Asked Questions
Does Thermo Fisher’s share performance mean peptide services are consolidating?
No. Thermo Fisher’s fiscal 2025 annual report contains no mention of “peptide” or “custom peptides,” and the disclosed growth driver inside Life Sciences Solutions is bioproduction at $3,200 million, up $548 million. The return figures are author-supplied market data that vary by source and date, not a statement about peptide capacity.
Can two peptide lots at the same HPLC purity deliver different amounts of peptide?
Yes. The assay requirements in the EMA guideline express assay on the counter-ion-free, anhydrous basis and define strength as peptide base mass, and counter-ion content must be controlled with a justified upper limit. Two lots at the same stated purity can therefore differ in deliverable peptide once counterion and water are accounted for.
Is a supplier certificate of analysis enough to release a peptide lot?
Only conditionally. 21 CFR 211.84 permits accepting a supplier report of analysis in lieu of full testing if at least one specific identity test is performed and supplier reliability is validated at appropriate intervals. The identity test and the validation interval are the practical control points.
Do the EMA peptide impurity thresholds replace ICH Q3A limits?
Yes, for synthetic peptides. The EMA guideline on synthetic peptides states that synthetic peptides are excluded from ICH Q3A/VICH GL10 and that Ph. Eur. peptide-related thresholds apply instead: report above 0.1%, identify above 0.5% and qualify above 1.0%.
Conclusion
The earned takeaway is that connection is a property of the record, not of the supplier’s size. A workflow is connected when the sequence version, modification chemistry, lot, method ID, column, gradient, wavelength and reference standard travel together with the purity, identity, net content, counterion and stability results, and when those records meet the audit-trail and signature-linking requirements of 21 CFR 11.10(e) and 21 CFR 11.50 and 11.70. The next step is to request a sample connected data package for one representative sequence from your current or candidate supplier and run the five questions against it; a package that fails question one or two is not a documentation gap but a reproducibility risk you have now measured.
Publisher disclosure: MOL Changes supplies peptide services and has a commercial interest in this topic. Service ranges and capability statements are supplier claims; availability and performance for a specific construct require project-specific evidence.