
How Kaizen in the QC Lab Starts With a Sample-Flow Map
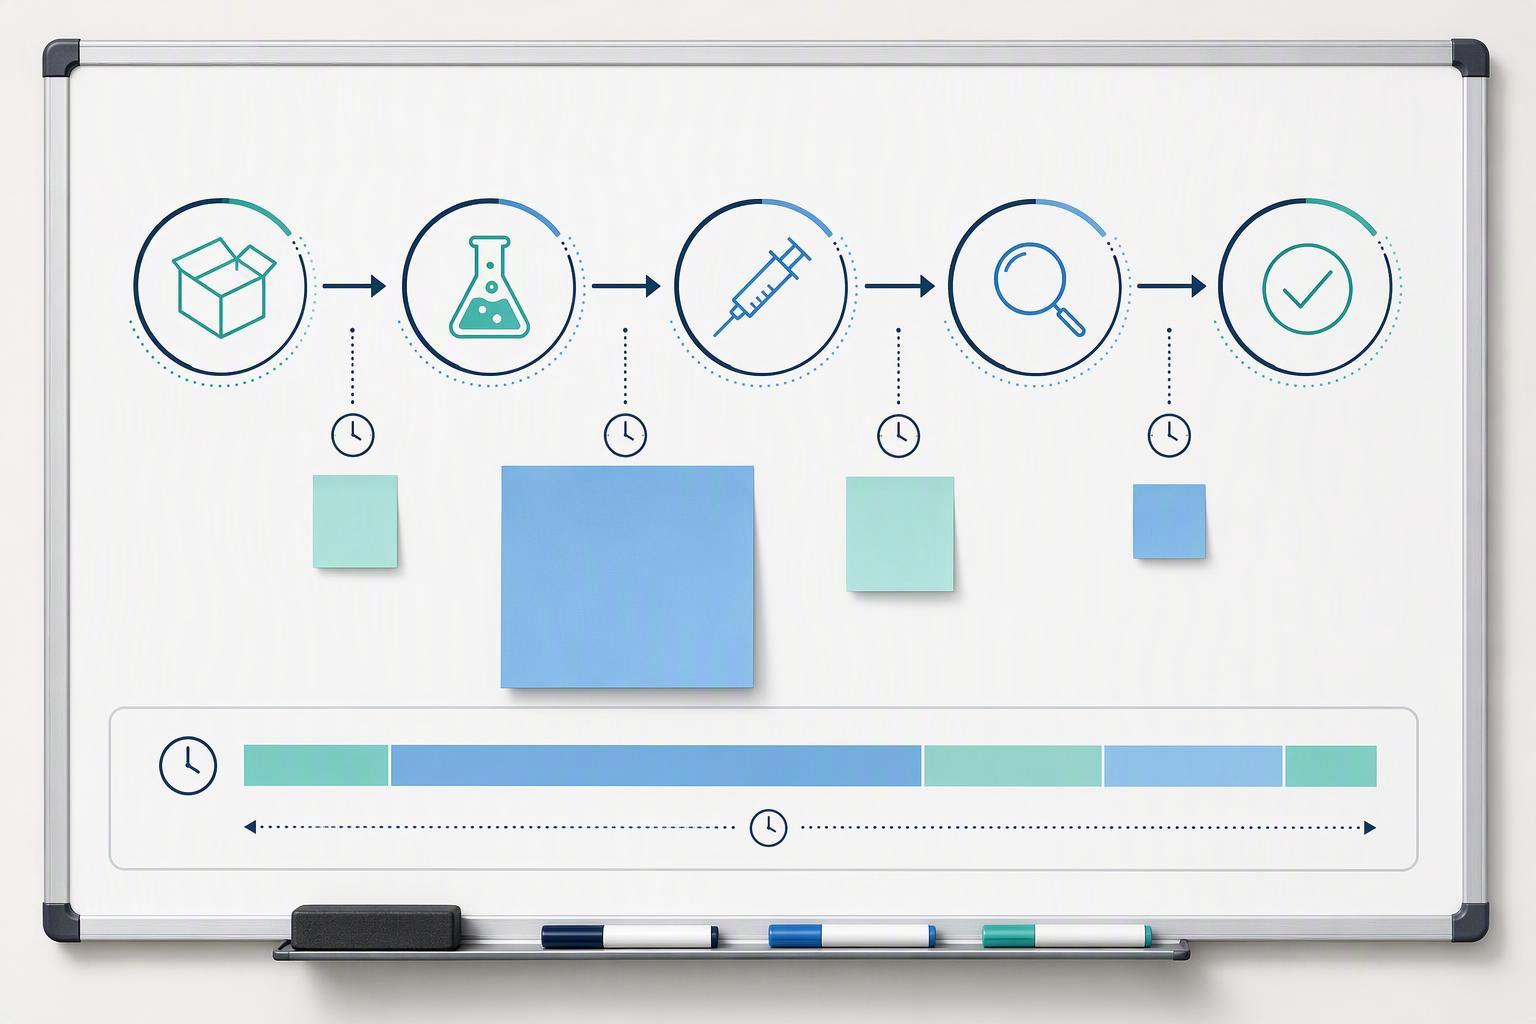
Before you change anything, make the current state visible. The micro-outcome of this first practice is a one-page sample flow map: a single peptide sample traced from receipt through preparation, injection, review and result release, with elapsed time and wait time marked at every handoff.
Build it by walking the physical path yourself and timestamping each handoff for one week. Do not rely on the LIMS report alone, because the system records when work is booked, not when a sample actually sits waiting.

The failure mode this prevents is improvement effort aimed at the wrong target. Teams often attack instrument speed first, yet scheduling overhead is a large share of lab time: a 2018 Tunnell/MassBio case study reported that sample scheduling accounts for more than 13% of a pharma QC lab’s operational time, measured at a single unnamed client site, so treat the figure as directional rather than universal.
Verify the map worked: it should show at least one handoff where the sample waits longer than it is worked on. If it does not, you have mapped the ideal process, not the real one.
Build a Repeat-Analysis Root-Cause Taxonomy
A rerun log without a classification scheme cannot tell a preparation problem from a method problem, so you fix neither and the repeat analysis root cause stays unaddressed. Four classes cover most peptide QC repeats.
|
Failure class |
Typical trigger |
Diagnostic evidence |
Justified action |
|---|---|---|---|
|
Sample preparation |
Hydrophobic or aggregating sequences; incomplete dissolution |
Peak area varies across injections while the sum of areas stays constant |
Redo preparation; change diluent or sonication time |
|
System suitability |
Column ageing; mobile-phase drift |
Resolution, tailing or %RSD outside the method criteria |
Re-equilibrate, replace column, re-prepare mobile phase |
|
Method instability |
Ion-pairing reagent or gradient sensitivity |
Selectivity shifts between runs on the same sample |
Revalidate the method conditions |
|
Genuine OOS |
Real batch defect |
Repeatable result on a fresh preparation and a second column |
Services Open a formal investigation |
Method instability is the class most often mislabelled as a sample problem. Waters showed that mobile-phase ion pairing changed whether an isomer resolved from the main peptide peak: under formic acid the lanreotide isomer was “well-separated from the main peak”, while “under TFA-mobile phases, only a shoulder peak appeared Shop next to the main peak” (Waters, Synthetic Peptide Impurity Analysis on Reversed-Phase Columns, 2018).
Shimadzu’s carryover diagnostics separate injector from sample: peak-area variation with a varying sum of areas points to the injector, variation in only some peaks points to sample instability, and a null injection that still shows the peak rules out the needle and sample loop (Shimadzu, Solving Carryover Problems in HPLC). The same symptom-to-cause logic in standard HPLC troubleshooting guidance names autosampler air draw, sample degradation, clogged needles, leaking seals and loose fittings, alongside insufficient equilibration at “at least 5-10 times the column volume” (Thermo Fisher Scientific, HPLC Troubleshooting).
Impurity identity sharpens the classification. A truncation is “the labelled sequence missing one or more residues from the N-terminus because the corresponding coupling cycle failed”, and because truncation products are shorter and less hydrophobic they “typically elute earlier than the main peak”, where “multiple truncation products eluting close together create the early-shoulder ‘fuzz’ pattern on the chromatogram” (Lyochem, Peptide Impurity Profiling Explained, 2026). An early shoulder is a synthesis signal, and a repeat will not clear it.
System-suitability failure is a method-health verdict, not a sample verdict. Convergent practice across peptide RP-HPLC methods sets resolution at Rs ≥ 1.5 for the critical pair, tailing factor ≤ 2.0, and replicate-injection precision of %RSD ≤ 1-2% for peak area or retention time (PepMax, How We Verify Peptide Purity, 2026). These are practice-typical values, not a regulatory threshold; USP <621> is the authoritative upstream source.
Key Takeaway: Classify every repeat before you run it. Preparation and method classes are fixed at the bench; only the OOS class justifies a formal investigation.
Decide Which Speed Levers Are Legitimate
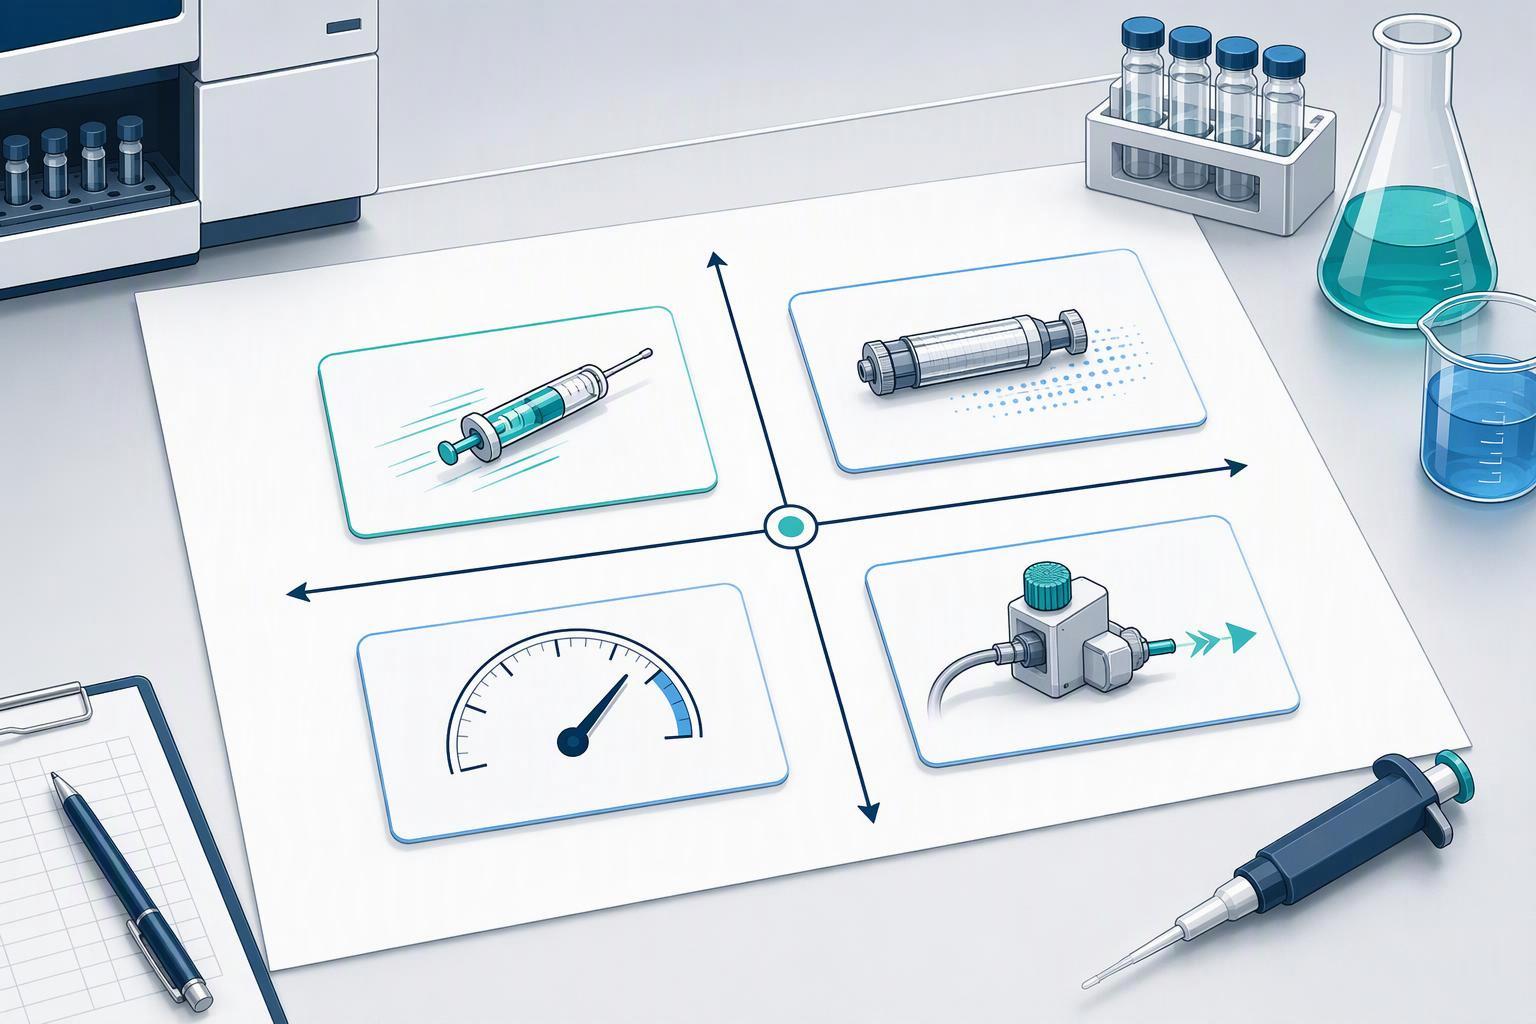
The levers that shorten peptide analytics turnaround without touching the validated method are scheduling and instrument discipline: batching samples by mobile phase, holding equilibration at 5 to 10 column volumes, controlling autosampler temperature, and prioritising the queue by commitment date. These change when work runs, not what the method does, so they carry no revalidation obligation. Levers that alter the method itself, such as a shorter gradient, a different column, or a raised flow rate, fall under ICH Q2(R2), adopted in November 2023, which requires that a change affecting the procedure’s performance be revalidated, at least for the affected characteristics.
That requirement is not a blanket ban on method change. The Q2(R2)/Q14 lifecycle approach treats a method as something you design to accommodate planned change, which is the legitimate route to a faster procedure.
Peptide Synthesis The failure mode sits on the scheduling side. Cutting equilibration below 5 to 10 column volumes to save minutes produces retention-time drift, and the rerun costs more than the minutes saved.
Calculate Capacity Against Demand Before You Commit
The arithmetic that decides whether Kaizen in the QC lab needs more instrument time or more analyst time is small enough to do on one page. Start with the hours an HPLC actually has available: total scheduled hours, minus planned maintenance, minus the equilibration overhead that standard troubleshooting guidance puts at “at least 5–10 times the column volume” before a run is stable (Thermo Fisher Scientific, retrieved 2026-06-04). What remains is your real HPLC instrument utilization, and it is usually well below the number on the schedule.
Then compare that figure against sample demand. If available hours exceed demand, your constraint is downstream: review, data integrity checks and release. Buying or scheduling more instrument time at that point adds cost without shortening turnaround.
Key Takeaway: In peptide QC, turnaround loss concentrates in queue time and avoidable repeat analysis, and the two are coupled: a rerun consumes the instrument slot the next sample needed. Confirm which constraint you actually have before you commit budget to either one.
Make Documentation Discipline the Enabler, Not the Tax
Documentation is what makes a faster peptide QC workflow defensible. Data integrity in the QC lab is not a compliance exercise bolted onto the speed work; it is the mechanism that lets a repeat analysis close in hours instead of escalating into an investigation.
The regulatory baseline is specific. Under 21 CFR Part 11, users of closed systems “shall employ procedures and controls designed to ensure the authenticity, integrity, and, when appropriate, the confidentiality of electronic records.” Section 11.10(e) requires “secure, computer-generated, time-stamped audit trails,” and states that record changes “shall not obscure previously recorded information.” That clause decides whether a rerun is routine: if the original integration and the reason for the change are reconstructable, the repeat is a data point. If not, it becomes a deviation. The MHRA’s GxP data integrity guidance, published in March 2018 and updated in September 2021, carries the ALCOA+ framing most peptide labs are audited against. Cite that document, not the withdrawn 2015 data integrity definitions it superseded. Instrument-side, USP <1058>’s fitness-for-intended-use framework, last revised in 2017, ties qualification records to the method the instrument is actually running.
For a peptide, a record that survives audit carries more than a purity number: sequence and sequence version, N- and C-terminus, modification site and chemistry, counterion form, lot, method ID, column, gradient, wavelength and reference standard. Those fields separate the five things one “purity” figure conflates: purity as relative main-peak area percent by HPLC, identity by orthogonal confirmation, content or net peptide, stability, and assay suitability.
Connected data packages are one way to hold that together. MOL Changes supports this pattern by pairing orthogonal HPLC purity measurement with high-resolution MS identity confirmation in a single traceable record rather than two disconnected reports.
The failure mode to design against is narrow and common: a rerun whose original result cannot be reconstructed from the record. The second injection then no longer answers the question the first one raised, and a two-hour repeat becomes a multi-week investigation.
Standardise the Change So It Survives the Next Audit

An improvement that lives in one analyst’s habit is not a Kaizen outcome. It disappears at the next staff change and cannot be defended in an inspection, because the controlled method still describes the old step.
Write the changed step into the controlled method or SOP, version it, and link the revalidation record and audit-trail entry to that version. ICH Q2(R2) requires revalidation when a change affects the procedure’s performance, so the trigger is the change’s effect on the method, not the size of the edit. USP <1058> frames the same question as fitness for intended use: show that the instrument and method still suit the purpose after the change.
Then keep it measurable. Track rerun rate by failure class, queue time per handoff, and right-first-time month over month.
Common Mistakes to Avoid
Treating undated vendor ranges as a benchmark. Consulting vendors publish headline improvement figures for QC-lab lean programmes, including 30–50% gains in resource utilisation, 10–20% increases in right-first-time, and 15–40% lead-time reduction from sample reception to result release, as vendor-reported ranges for QC-lab lean programmes from the Kaizen Institute show. The page carries no client, method, or date, so the numbers describe an unknown population. The consequence: a QC lead who sets 40% as a target gets judged against a figure nobody can reproduce. Use your own baseline instead.
Shortening equilibration below 5–10 column volumes. The temptation is real when a peptide method runs long and the queue is deep, but the symptom-to-cause logic in standard HPLC troubleshooting guidance treats retention-time drift and split peaks as equilibration symptoms first. Cut the step and the failure surfaces as a repeat analysis, which costs more time than the equilibration saved.
Changing mobile-phase ion-pairing to sharpen a separation. Ion-pairing reagent changes shift selectivity, and ICH Q2(R2) requires revalidation when a change affects the procedure’s performance. Treating it as a tweak rather than a method change leaves the validation package describing a procedure you no longer run.
Logging reruns without a failure class. A rerun count with no cause attached cannot be trended, so the same failure recurs unnoticed. Assign a class at the bench, while the chromatogram is still open.
Citing the withdrawn 2015 MHRA data integrity definitions. The 2015 guidance was withdrawn and replaced by the 2018 document. Building an audit response on the withdrawn 2015 data integrity definitions invites a finding that has nothing to do with your data.
Results: What a Working Peptide QC Kaizen Looks Like
A working peptide QC Kaizen is visible in four artifacts, not in a feeling that the lab is busier. You should be able to open a flow map with wait times marked at every handoff, a rerun log that classifies each repeat analysis by failure class, a capacity calculation that names the single binding constraint, and a controlled record that reconstructs any rerun without interviewing the analyst who ran it.
Track four metrics against those artifacts: rerun rate by failure class, queue time per handoff, right-first-time, and turnaround from receipt to release. One reported QC lab transformation cut throughput time by 30% in three months, lifted right-first-time from 95% to above 99%, and raised analyst productivity by more than 25% without adding equipment or personnel (Tunnell Consulting, 2018). Treat that as a single unnamed site’s result: no sample size and no measurement method were published, so use it as a direction of travel rather than a benchmark you can promise.
The stretch goal is extending the same taxonomy to stability and content Synthetic Peptides testing, where repeat analysis is usually rarer but harder to diagnose.
Frequently Asked Questions
How long does a Kaizen cycle take in a QC lab?
Most peptide QC Kaizen cycles run four to eight weeks from sample-flow map to standardised change. Three things drive the spread: how long the repeat-analysis root-cause taxonomy takes to build from your own records, whether the chosen speed lever touches a validated method, and how fast the change clears documentation review. A cycle that only reorders sample intake or batches system-suitability runs lands near four weeks. One that changes an HPLC gradient lands near eight, because revalidation sits on the critical path.
Does a faster HPLC method need full revalidation under ICH Q2(R2)?
Not automatically. ICH Q2(R2) requires revalidation when a change affects the procedure’s performance, so the scope follows the characteristics your change actually touches. Shortening a gradient or switching column dimensions can affect specificity, accuracy and range, and those need re-testing. Changes that leave the separation mechanism and detection intact, such as adjusting run batching or equilibration time, generally call for less. Document the risk assessment that justifies the scope you chose; that record is what an auditor reads.
What should I do when system suitability fails on a hydrophobic or aggregating peptide sequence?
Work the symptom-to-cause logic in standard HPLC troubleshooting guidance before touching the method. For hydrophobic sequences, retention drift and peak broadening usually trace to column temperature, mobile-phase organic content, or accumulated peptide residue on the column. For aggregating sequences, the failure often sits upstream of the column: sample preparation, denaturant concentration, or time between reconstitution and injection. Run the suitability standard again on a fresh column before concluding the method is at fault.
How do I distinguish a truncation from a deletion when mass alone is ambiguous?
Mass alone often cannot separate them, because a truncation and a deletion can produce the same nominal shift. Lyochem’s 2026 analysis of per-cycle efficiency explains why a 25-mer accumulates double-digit yield loss at 99.5% per-cycle efficiency, and that arithmetic is what makes truncation the more likely explanation in longer sequences. Resolve the ambiguity with MS/MS fragmentation rather than a second intact-mass measurement: fragment ions localise where the sequence breaks, which separates a missing terminal residue from a missing internal one.
Do these practices require new instrumentation?
No. The workflow runs on the inventory a peptide QC function already has: analytical HPLC or UHPLC for purity, and high-resolution LC-MS for identity. A complete peptide certificate of analysis also draws on ICP-MS for elemental impurity data and GC-MS for residual solvents, but those support release testing rather than the Kaizen cycle itself. The constraint is scheduling time on shared instruments, not acquiring new ones. If your LC-MS queue is the bottleneck, the capacity calculation in the previous section is where that shows up.
Conclusion
You now have five working instruments: a sample-flow map, a rerun taxonomy by failure class, a legitimacy test for speed levers, a capacity calculation against demand, and a documentation standard that holds up under audit. Apply them in that order at the bench, and the decision rule is simple: fix the class with the highest rerun count before you buy speed anywhere else. About
Track turnaround from receipt to release as the headline number, but watch rerun rate by class as the leading indicator. Turnaround tells you what happened last month; rerun rate by class tells you what will happen next month, and it moves first.
If you would rather work through the flow map and rerun taxonomy with someone who runs peptide analytics daily, talk to an expert about your current QC workflow.
Disclosure: this article was prepared by MOL Changes, which provides peptide analytical and QC services. Peptide Production